
Visualizing and quantifying protein interactions directly within native tissue transforms how researchers and clinicians understand disease biology, select therapies, and validate biomarkers. Hawk Biosystems’ QFPro® platform delivers quantitative, nanoscopic maps of protein function in formalinfixed paraffinembedded tissue, enabling actionable spatial interactomics that bridge discovery and clinical application.
Introduction
Mapping where and how proteins interact inside intact tissue reveals the molecular events that drive pathology and therapeutic response. Conventional approaches often report expression or localization but do not reliably measure protein functionality or biochemical engagement at the nanometer scale. QFPro® was developed to fill that gap by providing reproducible, quantitative readouts of protein–protein interactions and posttranslational modifications in routine clinical samples.
Clinical and Research Significance
Why this matters for clinical research
• Patient stratification becomes more precise when assays measure functional interactions that predict drug response.
• Biomarker validation benefits from tissue resolved, quantitative data that support clinical cutoffs and regulatory translation.
Why this matters for basic and translational research
• Understanding signaling networks in situ clarifies mechanisms of resistance, immune engagement, and microenvironmental modulation.
• In-situ quantitative interactomics accelerates hypothesis testing and shortens the path from discovery to validated clinical assays.
How QFPro® Improves on Traditional Methods
Quick comparison table
| Attribute | Traditional Methods (IHC/PLA) | QF Pro® (Hawk Biosystems) |
|---|---|---|
| What is measured | Protein expression or proximity inferred | Direct functional interactions and p ost-translational modifications |
| Quantitation | Observer dependent; semi-quantitative | Absolute, reproducible quantitative values |
| Resolution (nm scale) | Within 40-100 nm | Designed for 1–10 nm measurements |
| Sample compatibility | Variable | Validated for FFPE clinical samples |
| Dynamic range and sensitivity | Limited; low signaltonoise | High signal to noise with patented amplification |
| Clinical readiness | Often researchonly; hard to standardize | Standardized workflows with potential clinical utility |
| Functional specificity | Limited; infers activity | Directly measures functional events |
Traditional Methods (IHC/PLA) Explained and Their Limitations
• Immunohistochemistry IHC – IHC identifies protein localization and relative abundance across tissue sections. It is widely used in pathology but provides semi quantitative results that depend on antibody performance and subjective scoring. IHC does not directly measure molecular proximity or functional engagement.
• Proximity Ligation Assay ( PLA ) – PLA detects proteins that are near each other by generating a localized amplification signal when two antibodies are in close proximity(~40 nm). PLA improves detection of interactions but is semi-quantitative and often requires fresh or specially prepared samples and can be difficult to quantify across large tissue cohorts.
• Mass spectrometry and bulk proteomics – These methods quantify proteins and modifications with high specificity but lose spatial context because they analyzehomogenized tissue. In situ, spatial information is essential for understanding microenvironmental interactions.
How QFPro® Addresses These Limitations
Functional specificity : QFPro® reports signal only when functional events occur, converting engagement into a mechanistic readout of interaction or post-translational modification. This reduces false positives from mere colocalization.
• Nanoscopic resolution in FFPE : The platform operates under enhanced and amplified FRET-FLIM within 1–10 nm scale, while remaining compatible with routine FFPE workflows. This enables retrospective studies on archived clinical cohorts.
• Patented amplification for clinical samples : A proprietary amplification step increases signal strength and dynamic range so that QF-Pro® measurements perform reliably in patient tissue whereas traditional FRET fails.
• Quantitative, standardized outputs : Semi-automated analysis with Hawk’s Violet 3.0 microscope and QF-Pro® software measures and converts fluorescence decay (ie. lifetime and energy transfer) data into standardized, reproducible quantitative scores and maps that support clinical cutoff generation. This reduces observer bias and enables crosssite comparability.
• Workflow integration and multiplexing : QFPro® fits into standard immunofluorescence workflows and supports multiplexed assays to visualizefunctional events sequentially, giving a richer picture of protein interplay within the tissue microenvironment.
Core Technology Explained
What QF Pro® measures and how
• Two site antibody strategy labels two epitopes on the same protein or on interacting proteins. Secondary reagents carry a donor and an amplified acceptor fluorophore. Energy transfer between donor and acceptor (or donor fluorescence decay rate) is measured by fluorescence lifetime changes. The measured transfer is proportional to molecular engagement (1-10 nm) and thus reports functional events.
Why fluorescence lifetime matters
• Lifetime measurements are less affected by fluorophore concentration and photobleaching than intensitybased readouts. Hence, QF-Pro® yields robust, quantitative distance estimates that are converted into spatial maps across tissue sections.
Software and analytics
• Violet 3.0 system facilitates lifetime measurement, FRET efficiency data (QF-Pro® scores), and spatial mapping to produce standardized, highdynamicrange outputs suitable for biomarker development and clinical decision support.

Comparison between QF – Pro® and PLA
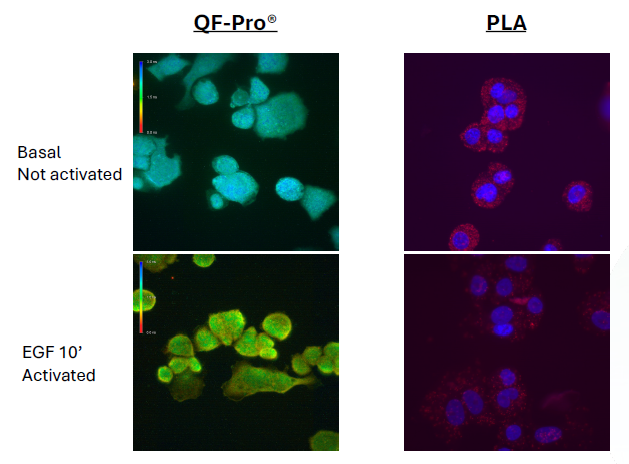
As an example of QF-Pro® performance compared to PLA, Akt/pAkt activation state in SKBR3 cells was quantified with both technologies. PLA images (right images) fail to provide substantial data on intensity changes and cell interactions in different conditions, impeding functional biomarker state detection. On the contrary, QF-Pro® allows precise visualisation of Akt/pAkt activation state (left images). The transition from blue (basal) to green/yellow (EGFR activated) indicates Akt/pAkt activation, particularly in EGF-stimulated cells, contrasting with basal conditions and providing a visual Akt/pAkt activation representation in SKBR3 cells.
The high dynamic range and operational sensitivity of QF-Pro® (left graph) allow it to quantify differences between the activation state of Akt/pAkt after an EGF stimulation time course. The qualitative nature of PLA (right graph), combined with its low dynamic range,means it is unable to detect differences in the activation state of Akt/pAkt. Even between basal (unstimulated) and highly EGF-stimulated cells, PLA was unable to identify statistical differences between the groups.

* Quantified by counting dots per cell as advised by PLA suppliers’ technical support
Case Study and RealWorld Applications
Hawk Biosystems has published a case study in the Journal of Clinical Oncology titled “Functional engagement of the PD-1/PD-L1 complex but not PD-L1 expression is highly predictive of patient response to immunotherapy in NSCLC”. This is a ground-breaking result which could increase patient responses to immune checkpoint inhibition (ICI) therapies in non-small cell lung carcinoma (NSCLC) by up to 280%. [Case study whitepaper: https://www.hawkbiosystems.com/wp-content/uploads/2025/06/QF-Pro-ICI-Whitepaper.pdf ]
• Immuno Oncology predictive assays : QFPro® assays have been applied to measure immune checkpoint interactions and signaling states that correlate with response to antiPD1/PDL1 therapies in lung cancer. These studies demonstrate the platform’s translational potential by accurately stratifying patients for therapy selection and trial enrichment.
• Validated biomarker repertoire : Hawk offers validated assays for immune checkpoint interactions, receptor dimerizations, and kinase activation states that support both discovery and clinical pipelines.
• Retrospective cohort analysis : FFPE compatibility enables retrospective analysis of archived clinical samples to validate biomarkers against longterm outcomes and to derive clinically actionable cutoffs.
Positioning Hawk Biosystems as a Leader
Unique advantages
• Bridging biomarker validation to the clinic with a platform that is both mechanistically informative and workflow friendly.
• Proven clinical relevance through case studies in immunooncology and a growing panel of validated assays.
• Standardization and accessibility via automated analysis and FFPE compatibility that lower the barrier for adoption in translational labs and clinical pathology units.
Why choose Hawk for translational programs
• Faster biomarker validation with spatially resolved functional data.
• Reduced technical risk when moving assays from research to clinical validation.
• Ability to interrogate archived cohorts to accelerate retrospective validation and regulatory readiness.
Conclusion
For researchers and clinicians seeking actionable spatial interactomics , QFPro® offers a step change: quantitative, functional maps in routine clinical samples that inform biomarker development and patient stratification. Hawk Biosystems combines patented chemistry, robust analytics, and FFPE compatibility to deliver reproducible, clinically relevant data that traditional methods cannot match.